Showing posts with label Devon. Show all posts

Thursday, May 31, 2012

The Great East vs. West Debate


If you are familiar with politics in Washington State, there’s no doubt you’ve heard of the rift between Western and Eastern Washington.  According to UW professor, John Findlay, this rift has been around since the 1880’s.  In a nutshell, Eastern Washington residents have been unhappy with the way politics in the state are seemingly dominated by the more liberal, Puget Sound legislators.  In particular, the tax and economic policy are thought to be “socialist” and bringing Washington deeper into a “welfare state.”  “Eastern Washington lawmakers are tired of getting stuck with legislation catering to the interests of the coast” Senator Frank Hansen from Moses Lake stated in the Ellensburg Daily Record.  In 1985, 1991, and again in 2001, Eastern Washington Republicans have introduced legislation proposing the secession of Eastern Washington.

These Eastern Washington legislators should be careful what they wish for, warns David Nice, a political science professor at Washington State University.  “It wouldn’t be a terribly strong state financially,” he said.  This seems a bit ironic, considering the state’s heavily republican east side is supportive of scaling back state government, reducing benefits to the most needy, and cutting taxes. 
Seattle’s alternative newspaper, The Stranger, published a compelling article on the exact nature of Washington’s “welfare state.”  It turns out, Eastern Washington residents are those that are subsidized the most by tax dollars.  With the latest 2001 proposal to split the state, Senator Bob Morton (R-Orient) stated, “We’re saying ‘Whoa, we don’t want to create a revolution, but we certainly do want our rights.  We want our culture, customs and lifestyle preserved.”  There seem to be some conflicting messages being sent by lawmakers in Eastern Washington.  Much like with many voters, there is a disconnect between perceptions and fact – about who pays for the majority of services and who is benefitting from them.

King County contains roughly 29% of the state population, produces 42% of state tax revenues, and receives back less than 26% of state benefits – a return of only 62 cents on the dollar.  Compare that to the $3.16 return on the dollar in Ferry County and you’d think that Eastern Washington should look at the facts before complaining that Western Washington receives a disproportionate share of state resources.  The chart on the total money each county receives from the state for each dollar is pays in taxes is a particularly good visual on the divide. 
This type of disparity spans all types of government – school districts and social services being the most prominent.  The following charts show you how certain counties (Yakima, Okanagon, Adams, and Stevens) are subsidized by the rest of the state.


Now, don’t get me wrong.  I do not think this disparity is bad or even ironic.  Those who need the most help should receive it from those who have surplus.  Anybody who lives in Eastern Washington will tell you that, of course, it costs more per capita to maintain core functions like roads and schools because the population is smaller.  The irony comes about when those who live in these less populated counties vote against measures that will directly impact the services they depend on.  It is this exact type of disconnect that needs to be discussed on a much larger scale.  Voters largely don’t think past how much it costs them as individuals to pay taxes.  They don’t make the connection between the services and subsidies they receive and their tax dollars.  It is this disconnect that must be discussed on a broader scale so that we can create a tax structure in our state that suits everyone’s needs – in good times and in bad. 


Property Tax 101: Exemptions, Credits, & Deductions

Part 2

In Part 1 of our discussion on property tax exemptions, credits, and deductions we touched on a higher-lever overview.  Today, we dive into a few of the more popular programs in the state.
A majority of the exemptions mentioned in Part 1 are targeted at organizations or entities that serve the public and add to the public good.  There are also a few exemption and deferral programs aimed at relieving the tax burden on certain groups of people.

Senior citizens/disabled persons can apply for an exemption if they are 61 years old or retired due to a disability and whose household income is $35,000 or less.  This exemption program, which was passed as a constitutional amendment in 1966, is a large one in the state.  According to the Department of Revenue, in 2009 (the most recent data available) $176.1 million in property tax relief was given to homeowners, which equates to an average savings of $1,555 per household – that’s no nominal figure! 


A related program for senior citizens/disabled persons is not an exemption program but a deferral program.  Under this program, seniors 60 years or older in a household that has less than $40,000 of disposable income can defer property tax collections until the property ceases to be the permanent residence  of the homeowner or surviving spouse.  The deferral then becomes a lien on the residence and is repaid from the proceeds of the estate.  In the meantime, the state reimburses local jurisdictions for lost revenue.  This deferral program isn’t as widely utilized as the exemption program.  In 2007, only 950 households took part in the program, compared to the just under 114,000 households that took part in the exemption program.
In 2005, a similar program was established for widows/widowers of veterans who died in the line of active duty.  In 2007, the legislature created a new deferral program for low-income households.  Those households with a combined income of $57,000 or less can qualify for the deferral program which allows taxpayers to defer half of their yearly property taxes; payment on the second half is then postponed until the residence is sold.

It is clear to see what the legislature’s priorities have been by looking at the history of property tax exemptions and deferral programs.  Those most vulnerable to losing their homes – seniors, low-income, and widows/widowers – are considered entitled to state assistance.  Do you agree with the legislature’s view?  Should we be subsidizing those in need?  Around the same time these popular programs were put into place, a Tim Eyman initiative (I-747) was voted into law, which restricted property tax valuations to 1% per year.  Clearly, Washington State residents were struggling with the cost of their property taxes and the legislature made an effort to help those most in need.

Property Tax 101: Exemptions, Credits, & Deductions

Part 1

Washington State’s Constitution allows for the legislature to declare certain exemptions for property taxes.  And declare they have!  Over the years, the number of exemptions, credits, and deductions has grown.   There are a number of classifications, too.  For example, there are various entities and types of property that are exempt from property taxes.  It’s probably no surprise that federal, state and local government owned properties are among those exempt.  But did you know that most non-profit organizations and many privately owned properties are exempt, as well?  For a complete list, read the Tax Reference Manual produced by the State Department of Revenue.  In the meantime, here are some examples:

Non-Profit Organizations:

·         Churches, parsonages, convents, and administrative offices of religious organizations

·         Humane societies

·         Assembly halls and meeting places

·         Thrift stores that sell only donated merchandise

Privately Owned Property:

·         Cemeteries

·         Widows/widowers of veterans

·         Property used to produce biodiesel, wood biomass, or alcohol fuel or as an anaerobic digester

·         Senior citizen and disabled homeowners (see below for a more detailed discussion)
As discussed in previous posts, some personal property is also exempt from taxation.  Certain intangible assets such as cash, stocks, and bonds are not included in property taxation.  Also, motor vehicles, farm equipment, commercial vessels, and recreational boats are exempt. 

In the 2012 legislative session multiple bills were introduced to expand exemptions or credits.  Here is a roundup:

·         SHB 1042/SB 5017 – Providing a property tax exemption for property held under lease, sublease, or lease-purchase by a nonprofit organization that provides job training, placement, or pre-employment services.  Did not pass.

·         HB 1385/SB 5628 - Concerning a limited property tax exemption from the emergency medical services levy.  Did not pass.

·         HB 1457 – Encouraging businesses to locate in vacant buidlings through a business and occupation tax credit for property taxes paid. Did not pass.

·         HB 2772/SB 6583 – Creating a property tax exemption for the value of new construction of industrial/manufacturing facilities in target urban areas.  Did not pass.

·         SB 6600 – Extending property tax exemptions to property used exclusively by certain nonprofit organizations that is leased from an entity that acquired the property from a previously exempt nonprofit organization.  Passed – effective 6/7/2012.

For more information on property tax exemptions, read part 2, coming soon.

Washington State Property Tax 101 – Overview


State property taxes account for approximately 13% of all state general fund revenue, making it the third largest revenue stream in the state.  Think of Washington’s tax structure as a three-legged stool (a reference made by former State Forecaster, Arun Raha, during a revenue forecast in 2011); the three legs (taxes) hold up the entire stool (Washington’s revenue sources).  To put things in perspective, the following chart shows you what our property tax collections look like relative to all other sources of revenue.  No surprise that the “three legs” account for nearly 80% of state general fund revenues.

In 2011, $8.9 billion in property taxes was paid by Washingtonians to state and local governments and school districts.  Of that, just under 55% (approximately $5 billion) was collected to support K-12 education.  Local governments rely heavily on property tax collections as well.  In fact, property taxes make up the largest revenue stream in tax collections for the locals, generating approximately $4 billion in 2011.  Clearly in times of economic downturn (especially The Great Recession with the huge hit to home ownership levels), K-12 education funding is directly at risk.  For further discussion on this, see this article.

As I briefly mentioned in the property tax history  post, the definition of taxable property has changed over the years and will undoubtedly continue to change as our technology evolves.  At its most basic level, it is defined in Article 7, Section 1 of our state constitution as tangible and intangible goods that can be owned.  Real property – land, structures, etc - and tangible property – generally everything else - are the two major classifications the state uses to define property.  The legislature has granted some exemptions; for instance, motor vehicles and household goods are not included in property tax assessments.

The same uniformity clause in the state constitution that prevents Washington from implementing a state income tax applies to property tax too.  According to the Legislative Guide to Washington State Property Taxes, “many other states have differential tax rates or different value standards that depend upon the separate classification of property.”  This type of system would be deemed unconstitutional in Washington and has been multiple times throughout state history.

Stay tuned for more posts about property taxes including a discussion on exemptions and how your property is assessed.


Washington State Property Tax 101:

The relationship between property taxes and public school funding

In Washington State, property taxes are the primary revenue source for public schools.  Of the state general fund, almost half goes to K-12 education – as shown in A Guide to K-12 Funding, $13.2 billion was dedicated to public schools in the 2009-11 biennium. The state property tax levy is commonly called the state school levy because the funds are dedicated to public schools.  The paid property tax, as well as all other tax revenue, is deposited into the general fund.  In 2000, voters approved Initiative 728, which transfers a portion of the state property tax from the general fund to the Student Achievement Fund (SAF).  This transfer of funds goes directly to school districts across the state to be used for class size reduction, extended learning opportunities for students, professional training for educators, and early childhood programs. 

In addition to the school levy, there are special levies.  Whereas the school levy is paid by all Washington property owners through the property tax, special levies are approved by voters for a specific school district.  Special levies are often called excess levies because the levy is in excess of the 1% limit on property taxes.  To read more about the 1% limit visit this post. 
Over the years, reliance on special levies to fund school operations has decreased, largely in part to the Seattle v. State of Washington State Supreme Court decision in which Judge Doran directed the legislature to define and fully fund basic education for all students in Washington State.  After that, in 1977, the legislature enacted the Basic Education Act, increasing state funding support to public schools and limiting the special levy limits.  Still, special levies remain an important part of funding for public schools.  In 2010, 281 of the state’s 295 school districts passed a special levy aimed at maintenance and operations for school districts.

Property Tax 101: The Limit Factor


In recent years, residents of Washington State would think little of Governor Gregoire calling a special session of the legislature simply because it has become a very common occurrence as of late.  However, in November of 2007, when the Governor called her first special session, it was unexpected. The special session was called for the purpose of reinstating a 1% limit, or cap, on property taxes. 

The first limit on property taxes was passed by the legislature in 1971 and only affected regular property taxes at the local level.  This limit required that any property tax levy not exceed 106% of the highest amount of revenue received from any levy in the preceding three years.  Eight years later, the legislature extended this same provision to state property taxes, as well.
 A couple decades later, Washington State voters passed Referendum 47, which required additional limits on top of the 106% limit.  Beginning in 1997, taxing districts with a population over 10,000 could only increase regular levies by the inflation rate or 6%, whichever was smaller.

Not long after, in 2000, Initiative 722 (I-722) was passed.  I-722 limited future property tax increases to 2% and rolled back certain property tax increases levied in the year 2000.  The State Supreme Court ruled I-722 unconstitutional because it was not limited to a single subject.
With the help of Tim Eyman, voters were back at it in 2001 with I-747, which restricted property tax increases to the lesser of inflation or 1%, sending legislators a clear message that property taxes were growing too quickly and they wanted that growth curbed.  Six years later, the State Supreme Court overturned I-747 stating that it didn't include proper disclosure to voters.  In other words, the court believed voters didn't fully know what they were voting on.
The legislature and Governor Gregoire disagreed and quickly called a special session in late 2007.  House Bill 2416 reinstated the 1% levy limit established by I-747 and remains intact today.

What exactly is a tax shift?

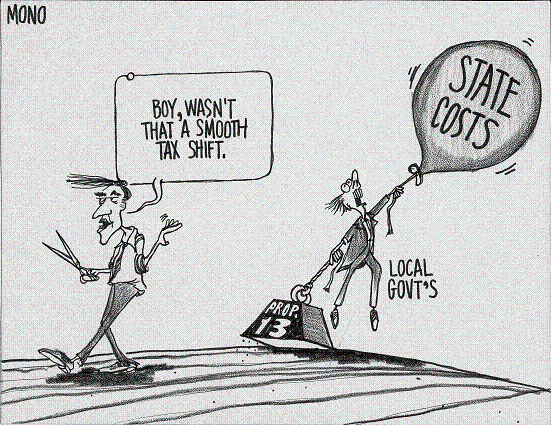
The term tax shift isn’t one that’s very complex or hard to understand.  However, it is used in various forms, all with different meanings.  Some refer to a tax shift as the transfer of some or all of a tax burden from one entity to another.  For example, shifting a tax burden from state government to local government.


At its most basic level, a tax shift occurs when an exemption is put into place.  For example, as discussed in the 2012 Legislative Guide to Washington State Property Taxes, the senior citizen’s property tax exemption has the effect of, “slightly increasing the tax rate that owners of all other taxable property must pay by reducing the overall base of taxable property” (pg. 5).  In other words, one segment of taxpayers’ taxes are increased as a direct result of the exemptions afforded to others.
Of course there are many reasons to offer exemptions for people and businesses that benefit society as a whole.  Small business, seniors, and disabled populations are just a few groups that the legislature has deemed deserving of exemptions and most Washingtonians would agree that helping these vital groups benefit us all. 
However, as detailed in a previous post on the cost of exemptions in Washington State, there are 640 tax exemptions.  Of those, 452 would likely generate revenue if eliminated.  I’m not going to suggest that all of those exemptions should be repealed.  I see exemptions as playing a vital role in how our economic systems work.  Some tax exemptions stimulate growth in the economy and help small businesses survive.  Nevertheless, by leaving as many exemptions as we have in place, the tax burden is shifted to those most vulnerable in the state – mainly through the sales tax.  Certain exemptions have been on the books for decades and their relevance has certainly expired long ago.  To have a working tax system we need to be constantly looking at why our system is in place – not just do as we’ve always done.  In order to reform our tax system there needs to be thoughtful examination of our current exemptions combined with major alternatives to our reliance on the volatile sales and property taxes.  In doing so, the tax shifts currently burdening our most vulnerable populations could be minimized which will ultimately help the overall economy of the state.

Wednesday, May 30, 2012

Two States’ Competing Tax Systems

Washington and Oregon share a very unique situation: two states and one metropolitan region with an economic structure unlike any other in the country.  Oregon has one of the top income tax rates in the country, and Washington has one of the top sales tax rates, making it almost impossible for their tax systems to be any more different . 

To add an additional ripple to the fold, Washington has a controversial sales tax exemption for all Oregon residents.  Washington lawmakers believed that without an exemption, Oregonians wouldn’t shop in Washington since they could shop in their home state and pay no sales tax at all.  All it takes is an Oregon driver’s license and there’s no sales tax charged.  Not surprisingly, businesses on border cities and towns greatly dislike the exemption.  Washington State Representative Jim Moeller told Pew Center on the States, “Sixty-thousand of my constituents pay Oregon income tax and help support their parks and their roads and their health care.  When Oregonians find themselves over here and they need to pick up a shirt or a pair of shoes or whatever, they should help pay for our parks and our roads and our health care just as much as we pay for theirs.”  Oregon isn’t the only state which benefits from the exemption.  Alaska, Colorado, Montana, and New Hampshire among others benefit as well.
To complicate matters, Washington residents are required by law to pay use tax on goods or certain services when a sales tax has not been paid.  However, this practice is widely ignored in the state. See Phil’s use tax post here.

That leads us to the question--does any of this really matter?  Are residents in both Oregon and Washington traveling en masse and moving across one border to the next in order to dodge the tax burden?  Overall, experts have mixed thoughts on the issue. 
Portland-based economist, Joe Cortright believes the disparate tax structures do not play a large role in each state’s economy – even though he believes Clark County is losing $100 million annually in sales tax revenue.  Some factors which support his position are that many Washingtonians live in Vancouver yet work in Portland.  So, they are paying Oregon’s income tax and Washington’s sales tax.  One positive for this group of Washington residents is that homes are cheaper in the border area of Washington.  

Many believe that the various tax structures are not a major determinate of residents’ shopping habits.  People are going to live where they want to live, shop where is most convenient, and work where they want.
A question raised by the article by the Pew Center on the States is not whether the current tax structures of each state is hindering economic growth for the other, it’s whether or not both states are being well served by their respective tax structures.

By now, every reader of this blog should know that Washington’s tax structure, which is so heavily reliant on the sales tax, is one of the most regressive in the country.  And, given Oregon’s boom-or-bust revenue cycles reliant on their income and corporate gains taxes, they’ve got some work to do, too.  The message the authors of this blog have been trying to get across is that Washington State’s tax structure needs to be reformed so that it isn’t so heavily reliant on one particular tax – a volatile one at that.  Oregon faces the same troubles we have – they rely too heavily on one source of tax revenue.  Just like you’d want to diversify your investment portfolio, we need to diversify Washington’s tax structure so that in times of high volatility, we have something to rely on. 
One poignant quote included in the Pew Center on the States article by Randy Miller, an active Portland business leader, “Enlightened people here all feel the same: We need a sales tax.  Enlightened people in Washington feel the same: They need an income tax.  The general public?  Forget it.”


Monday, May 14, 2012

Washington State Property Tax 101: History


This overview of Washington State property taxes is the first in a multi-part series focused on shedding some light on our state’s property tax system.  It is intended to condense and simplify the myriad of information already available.  If you are interested in more detailed information, head over to the Department of Revenue’s (DOR) webpage.

The Organic Act of 1853 not only established the territorial government of Washington but also required that taxes assessed on property be administered uniformly and provide exemptions for benevolent institutions, federal property, and churches.  Thus began the first tax in Washington’s history.  When Washington gained statehood in 1889, the property tax laws remained largely the same.  Property taxes were the principle revenue source for Washington from the Organic Act of 1853 to the early Depression years. 

In the 1920s and 1930s, property tax rates began to rise.  According to DOR, rates of 2.5% - nearly three times what they typically are today – were not uncommon during this time period.  During the Depression Era, efforts were made to reduce burdensome property taxes because they were no longer an accurate predictor of wealth.  As society moved from largely agrarian production to industrialization, property ownership changed.  Reliability on property tax revenue was at an all-time low in a time when demand for government resources and services was at an all-time high.

An effort made to help alleviate the tax burden (which you’ve read about multiple times on this blog) was an attempt to pass a graduated income tax.  Initiative 69 was passed by voters with 70% approval in 1932, but the state supreme court ruled the law unconstitutional because of the graduated rate structure.  Taxpayers did get some relief in 1933 and 1935 when the state sales and business & occupation taxes were passed. 

On the same ballot as Initiative 69, was an initiative to limit property tax rates, which passed.  During the following decade, voters approved multiple limitations on property tax rates which severely reduced the property tax revenue.  Additionally, a few exemptions were put into place: certain intangibles, household goods, and motor vehicles.  In the 1970s, even more exemptions were adopted: senior citizen and open space program being the most notable. 

In 2001, Initiative 747 (an Eyman initiative) was approved by voters.  This initiative placed further restrictions on taxing districts in regards to how much revenues may grow from year to year.  Before the initiative, growth rates were tied to inflation and not to exceed 6%.  Under the new initiative, growth could not exceed 1% annually.  Even though the law was deemed unconstitutional in 2007, the Legislature enacted a similar statutory limit of 1% and is currently still in place. 

In 2009, legislation requiring that all property be assessed for value annually by 2014, as opposed to every four years which had been the law since 1955, was enacted.

Overall, it’s clear to see that Washington’s property tax history is complex and ever-changing.  Stay tuned for a breakout of detailed property tax issues and a roundup of property tax stories in the news.  For a timeline of significant events go here. 

How Does Washington State Stack Up?

Think Washingtonians have it bad when it comes to taxation?  Have you ever wondered how Washington's taxes compare to other states and the U.S. as a whole?  As it turns out, we aren't the worst off in the U.S.  In fact, according to 2009 data (the most recent complete data available) Washington is below average in per capita state and local taxes.  As shown in the chart below, Washingtonians pay $4,049 in property, sales, and other taxes on average annually.  That is slightly below the national average of $4,141 per capita - a 2.2% difference.   
Washington's tax structure is different than many other states.  We are one of seven states that doesn't impose a state income tax.  However, Washingtonians are unduly burdened by the state's relatively high sales tax - one of the most regressive taxes out there.  On average, Washingtonians spend $1,850 on sales tax.  The U.S. average is only $948.  That is an astonishing 95% difference.

Compared to other states, Washington ranks 21st in the nation for the cost of state and local taxes per capita.  Only twenty other states have taxes higher than Washington.  As noted in "A Citizen's Guide to the Washington State Budget," an especially informative publication by the Senate Ways & Means Committee, this ranking has been used to gauge Washington's tax burden on residents.  However, in recent decades this measure has not been as reliable as it once was due to the explosion of wealth (aka stock options) in the late 1990s and 2000s.
If you are interested in more information or seeing compelling visual comparison's, check out the "My Money Blog" post on state comparisons.  This post sources the information from The Tax Foundation, a self-described nonpartisan research group dedicated to "educate taxpayers about sound tax policy and the size of the tax burden borne by Americans at all levels of government." 

Donald Duck Wants You to Pay

Your federal income taxes, that is. 

In the midst of World War II, the American Government sought a way to finance its defense spending, which was roughly 70% of all federal spending in 1943 - this was markedly up from the 18% of total federal spending in 1940 (EH.net, 2010). 


As you can see from Table 1, the increases in manufacturing output in the U.S. were remarkable in the five years shown. Most of this increase can be attributed to boosted government subsidies that were funded by taxpayers. The government depended on this tax revenue and used it as a means to fight the war.


So what do you do when citizens aren’t paying their income taxes? Well, you use Donald Duck propaganda to scare people into paying their income taxes! The video posted above was released in 1943 in an effort to educate and encourage Americans to pay their federal income taxes. Maybe that’s why income tax collections in Washington Territory during the Civil War Era were a flop? 

According to Phil Roberts, author of A Penny for the Governor, A Dollar for Uncle Sam (2002), Washingtonians weren’t so cooperative when it came to paying their federal income taxes in the mid nineteenth century.  He attributed this to many factors such as geography, population demographics, and the collection agents assigned to Washington Territory.  Also, newspapers in Washington weren’t labeling tax evaders unpatriotic like they did in many other territories and states.  However, in an effort to get more people to pay their federal income taxes, the government did make all tax returns public, like the one shown below.  You can even see President Lincoln’s taxes paid, $1,296, from 1864.